1
Commercial
Jul 13
293
₹99 Lac
₹55,000/sq.yd
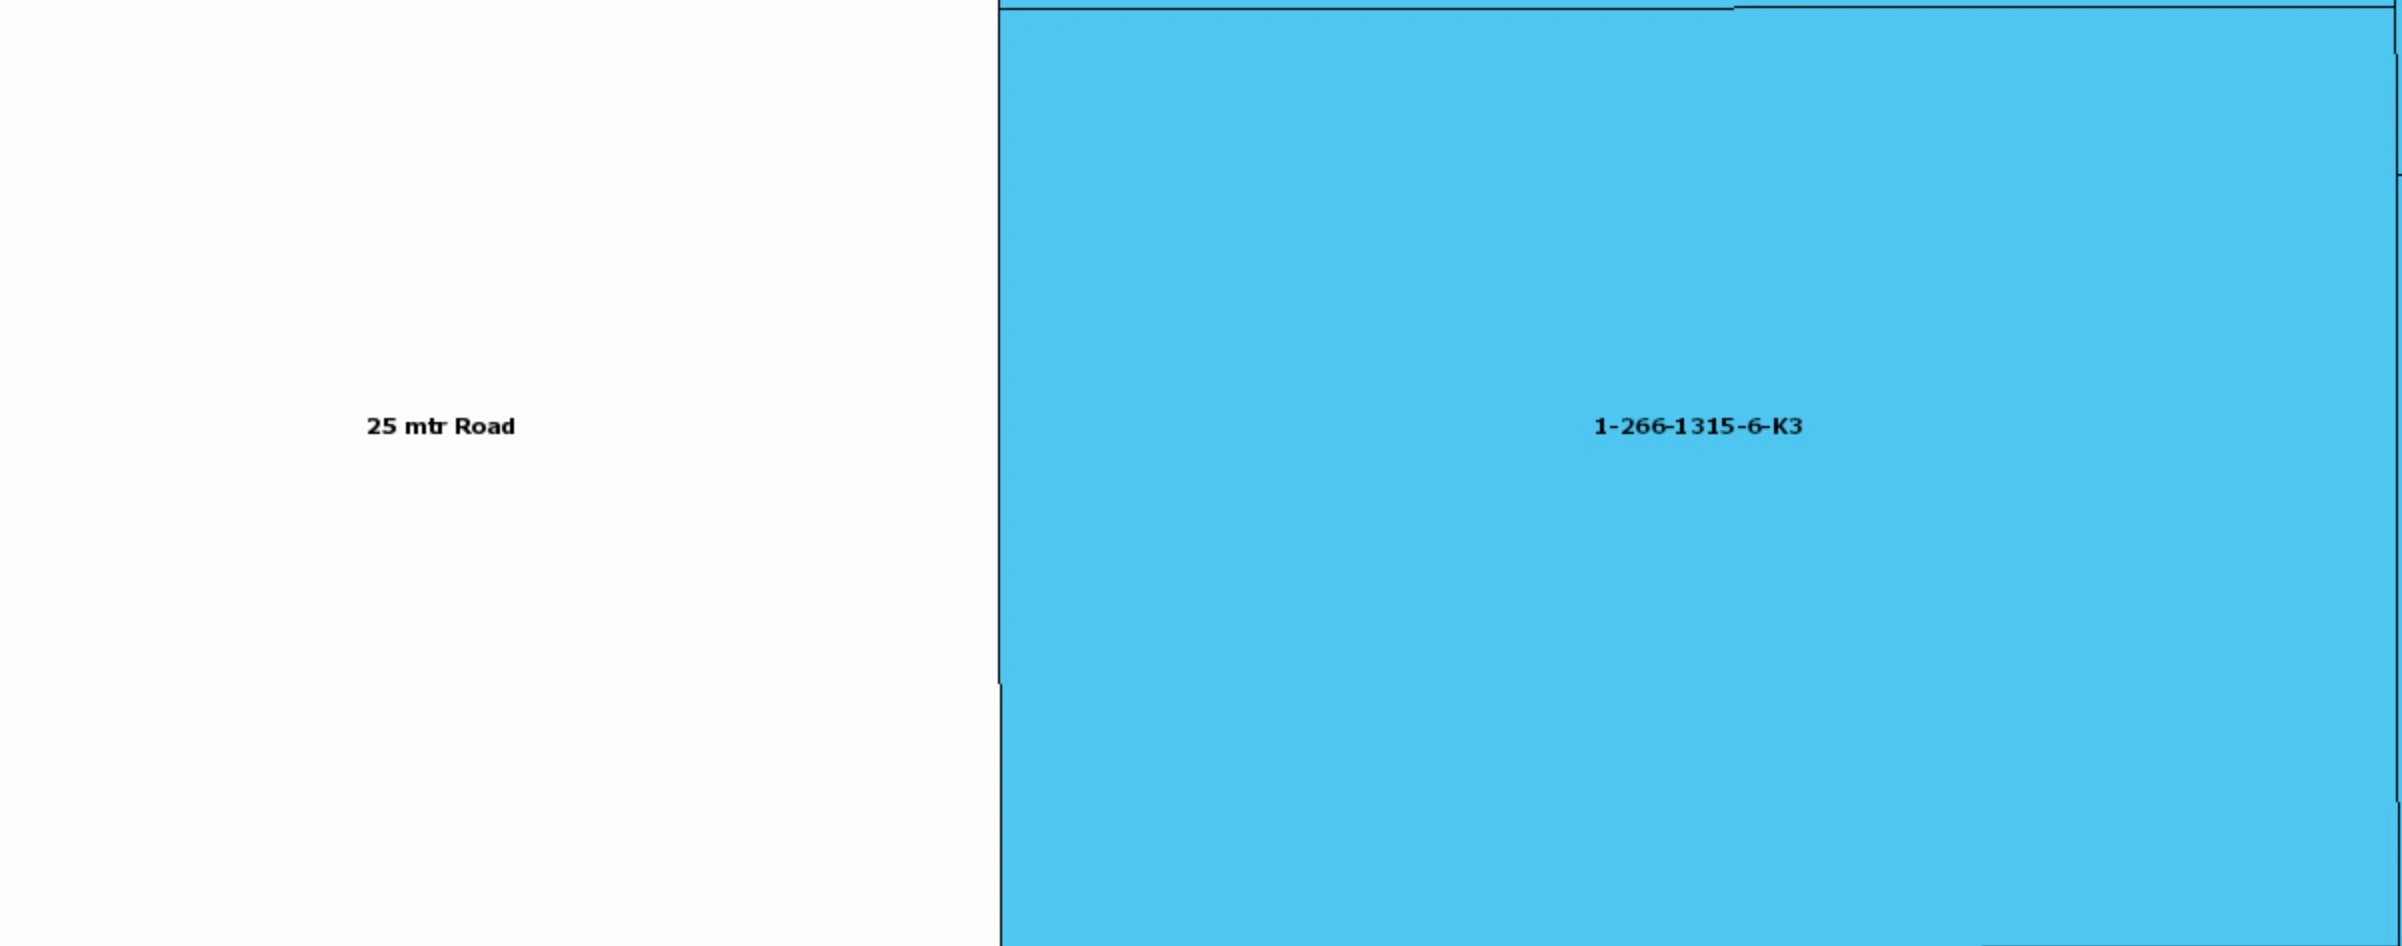
180 sq.yd Commercial plots are available in Thullur
180 sq.yd
East Facing
Seller: Ghattamenini/vr